trainometer
TrainOmeter


TrainOmeter is a simple
Shiny application designed to give you a quick
overview of your travel history based on the cryptic .csv data exported from
the Mijn NS portal.
Check out the application at
mihaiconstantin.shinyapps.io/trainometer
Features
Viewing and filtering NS data
TrainOmeter allows you to quickly process the NS data export and filter it based on various inputs. Upon opening the application, you are presented with the following screen (i.e., see image below):
Application Structure
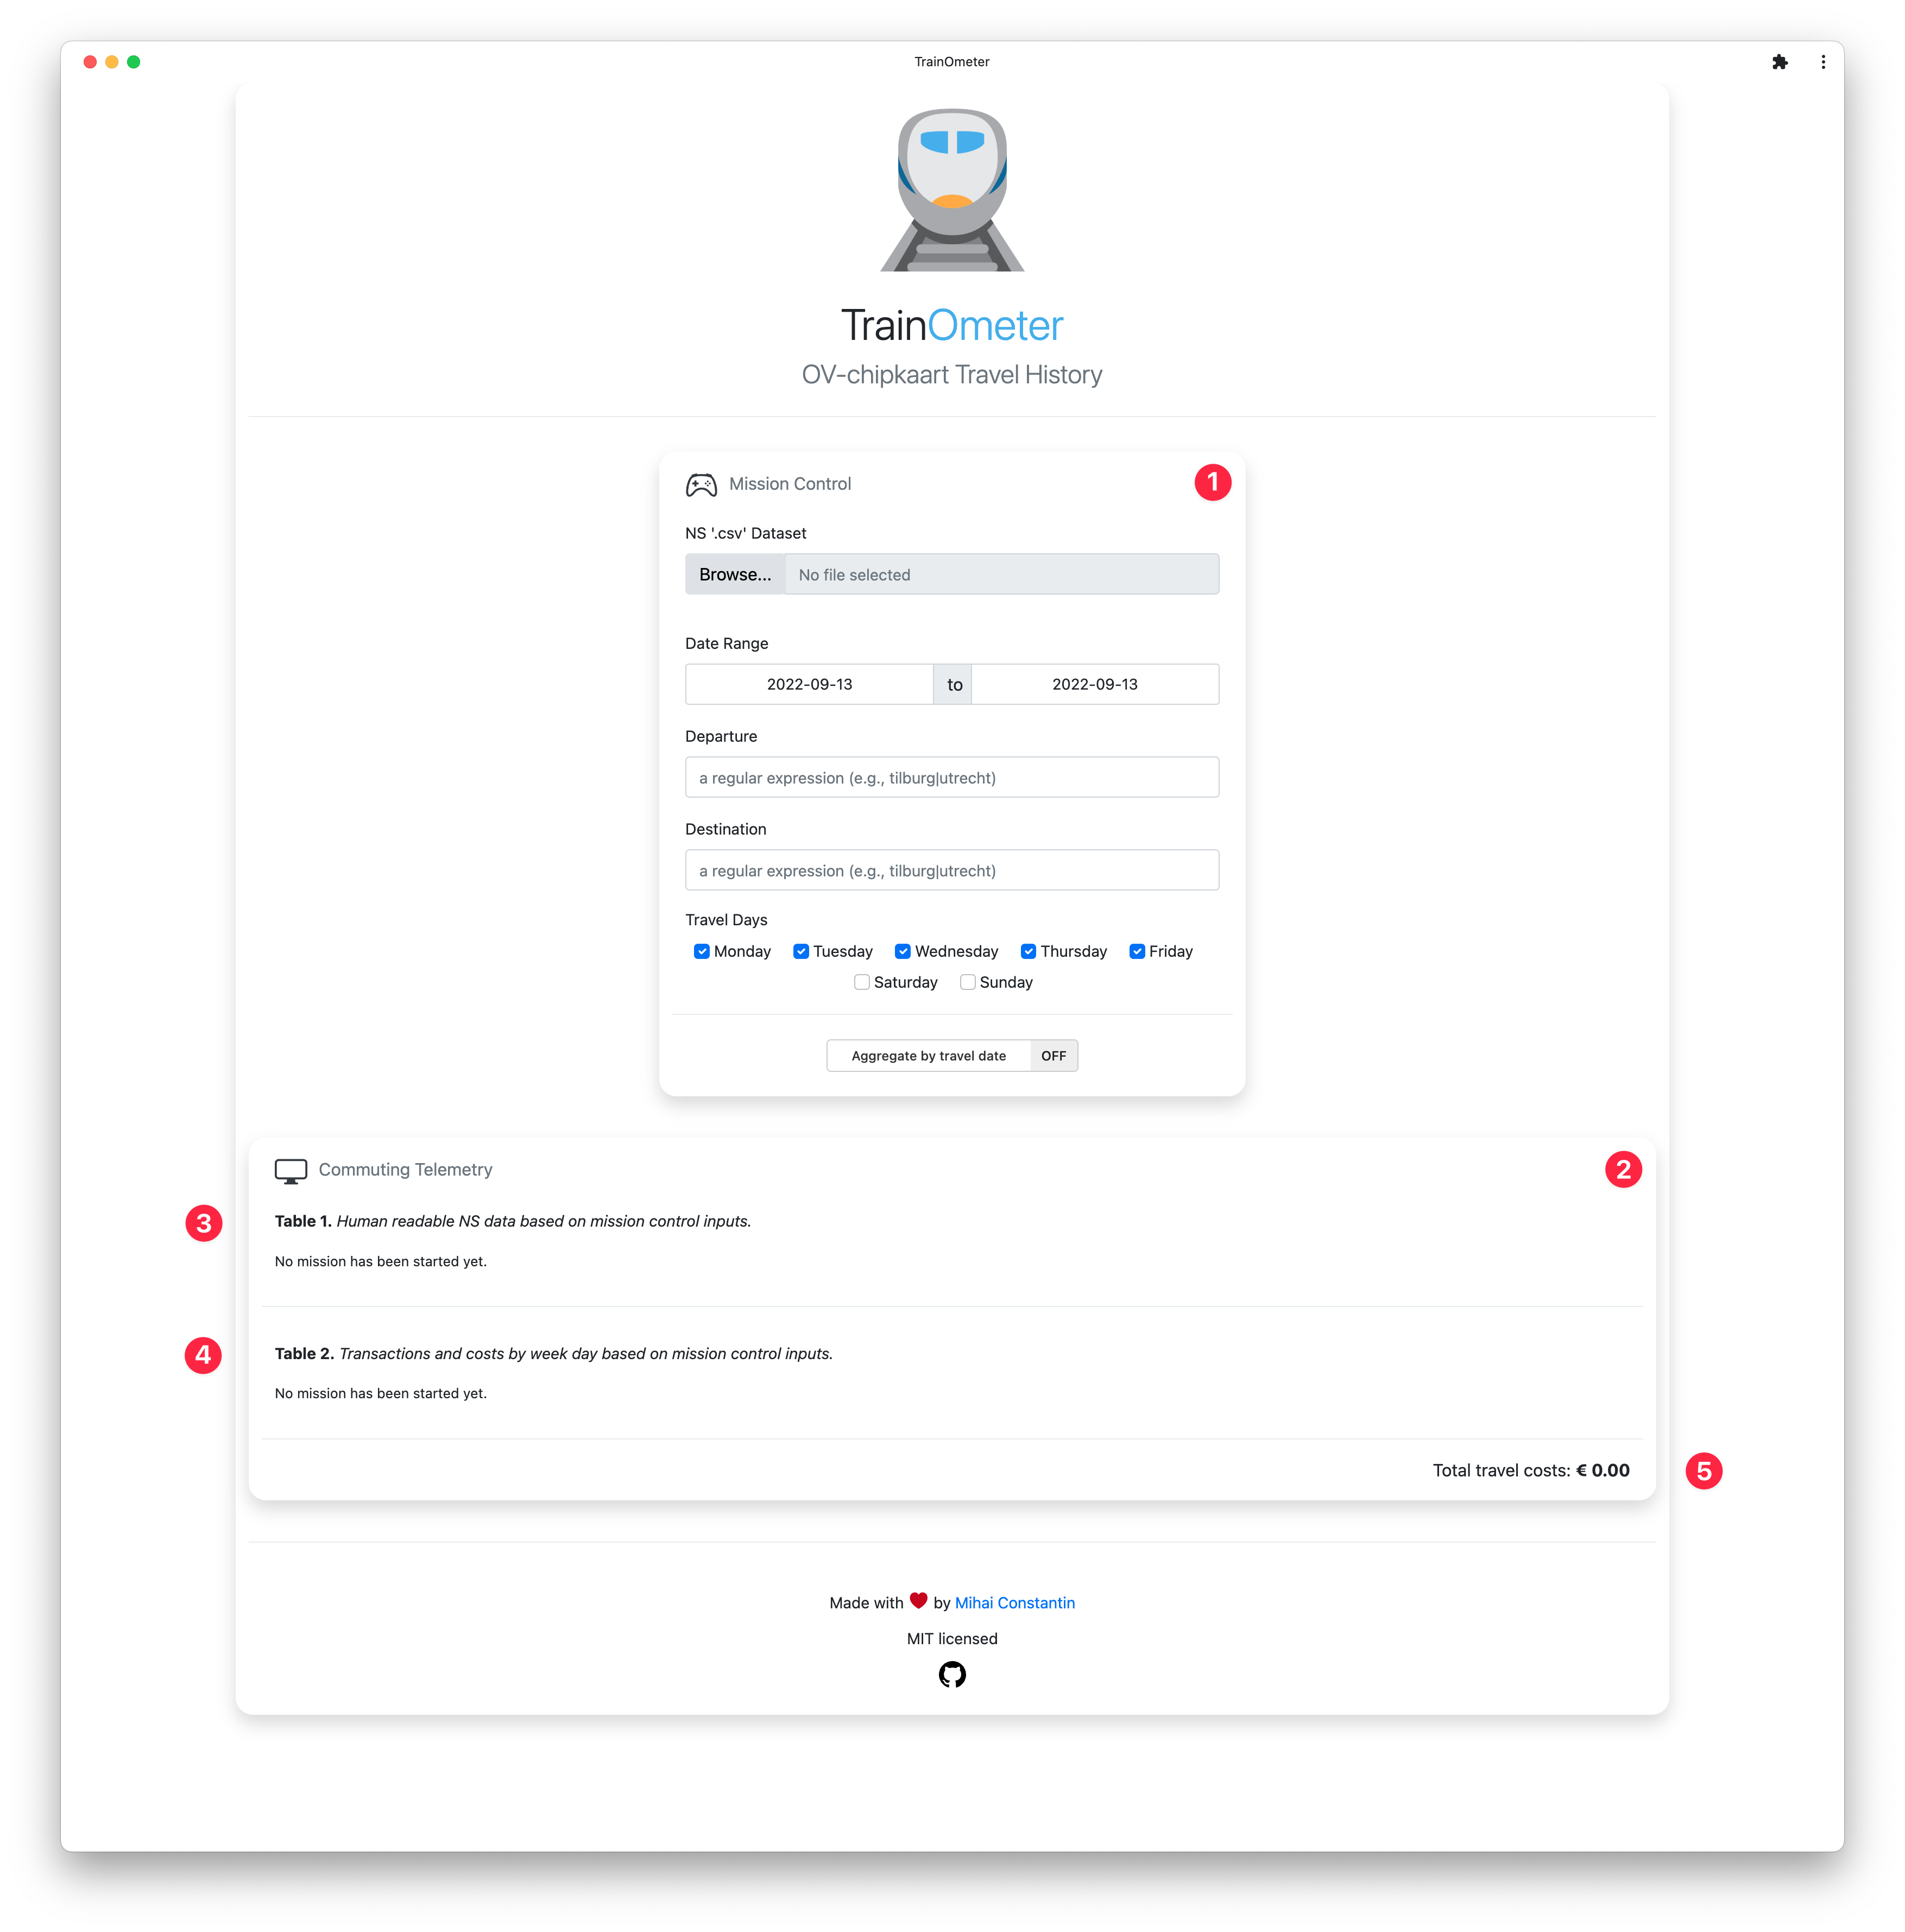
The application consists of two main panels, the Mission Control and Commuting Telemetry panels, which are indicated with numbers one and two in the image above. The Commuting Telemetry panel is further divided into three sections (i.e., see below).
Mission Control
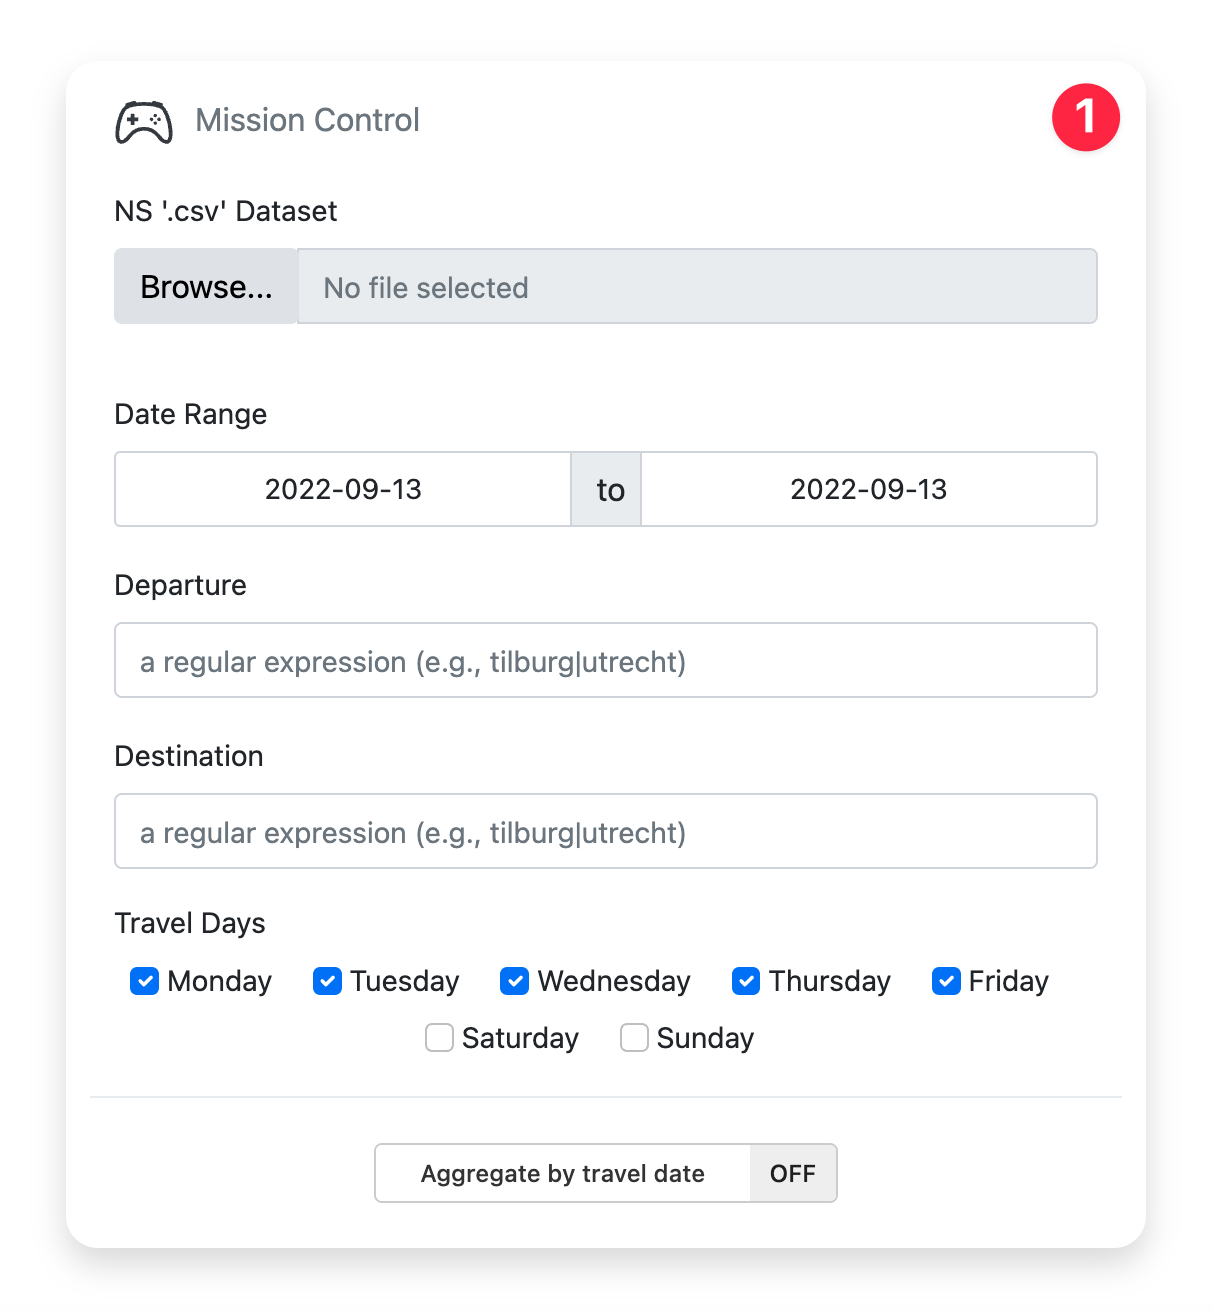
The Mission Control panel (i.e., as seen in the image below) contains all the
inputs necessary to upload the data, process it, and filter it accordingly. For
example, using the form inputs in this panel, you can filter the data based on
travel dates and travel days. Moreover, you can filter the data based on the
departure and destination station using Regular
Expressions(i.e., regex)
based on the PCRE flavor.
Finally, this panel also provides an oddly positioned switch to aggregate the
data by travel date.
Mission Control Panel
Commuting Telemetry
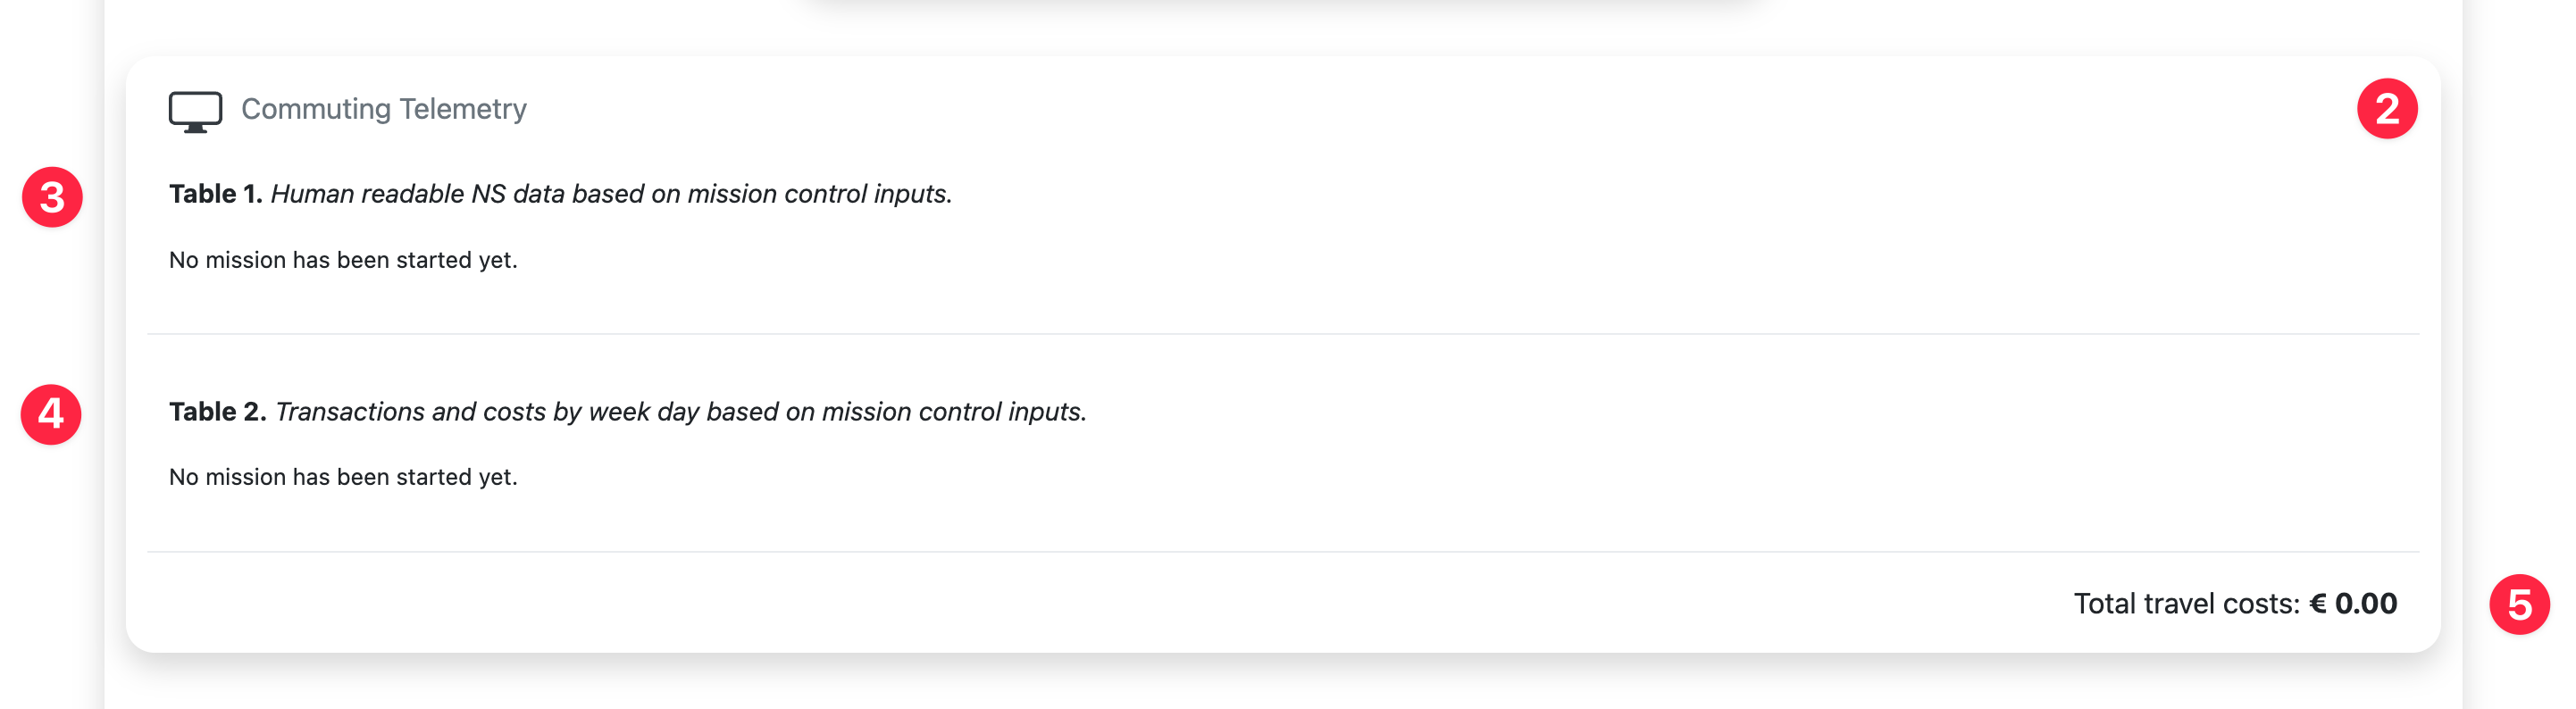
The Commuting Telemetry panel (i.e., see the image below) displays the processed NS data, while taking into account the filters specified in the Mission Control panel. This panel is divided into three sections:
-
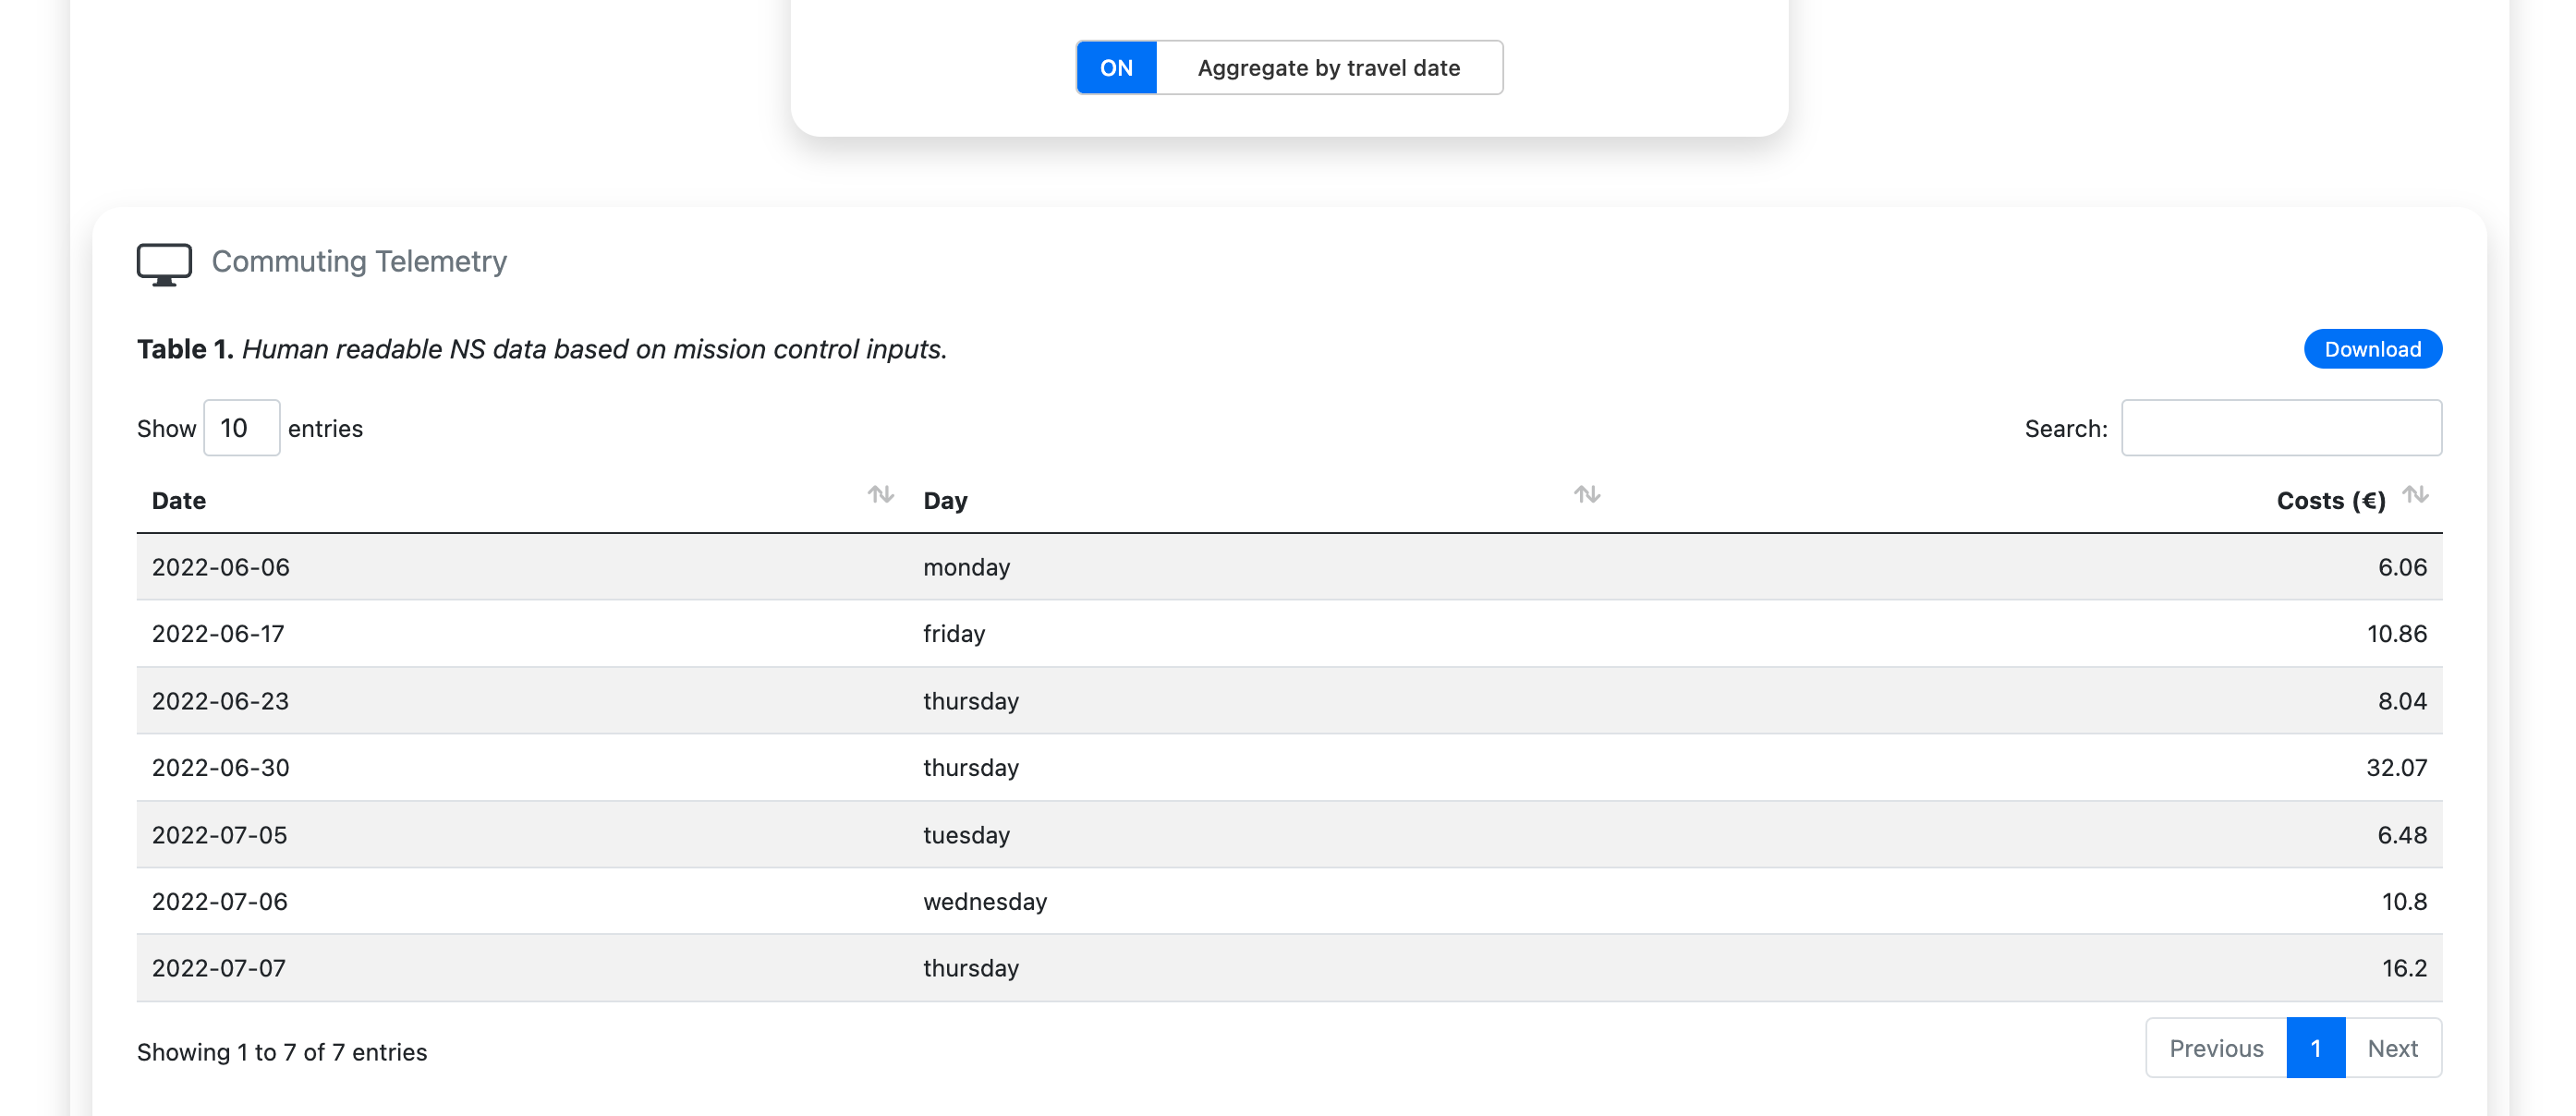
Table 1 (i.e., indicated by number three) displays the processed NS data or the aggregated variant (i.e., when the aggregation switch is active). In either case, the data displayed is based on the filters selected above.
-
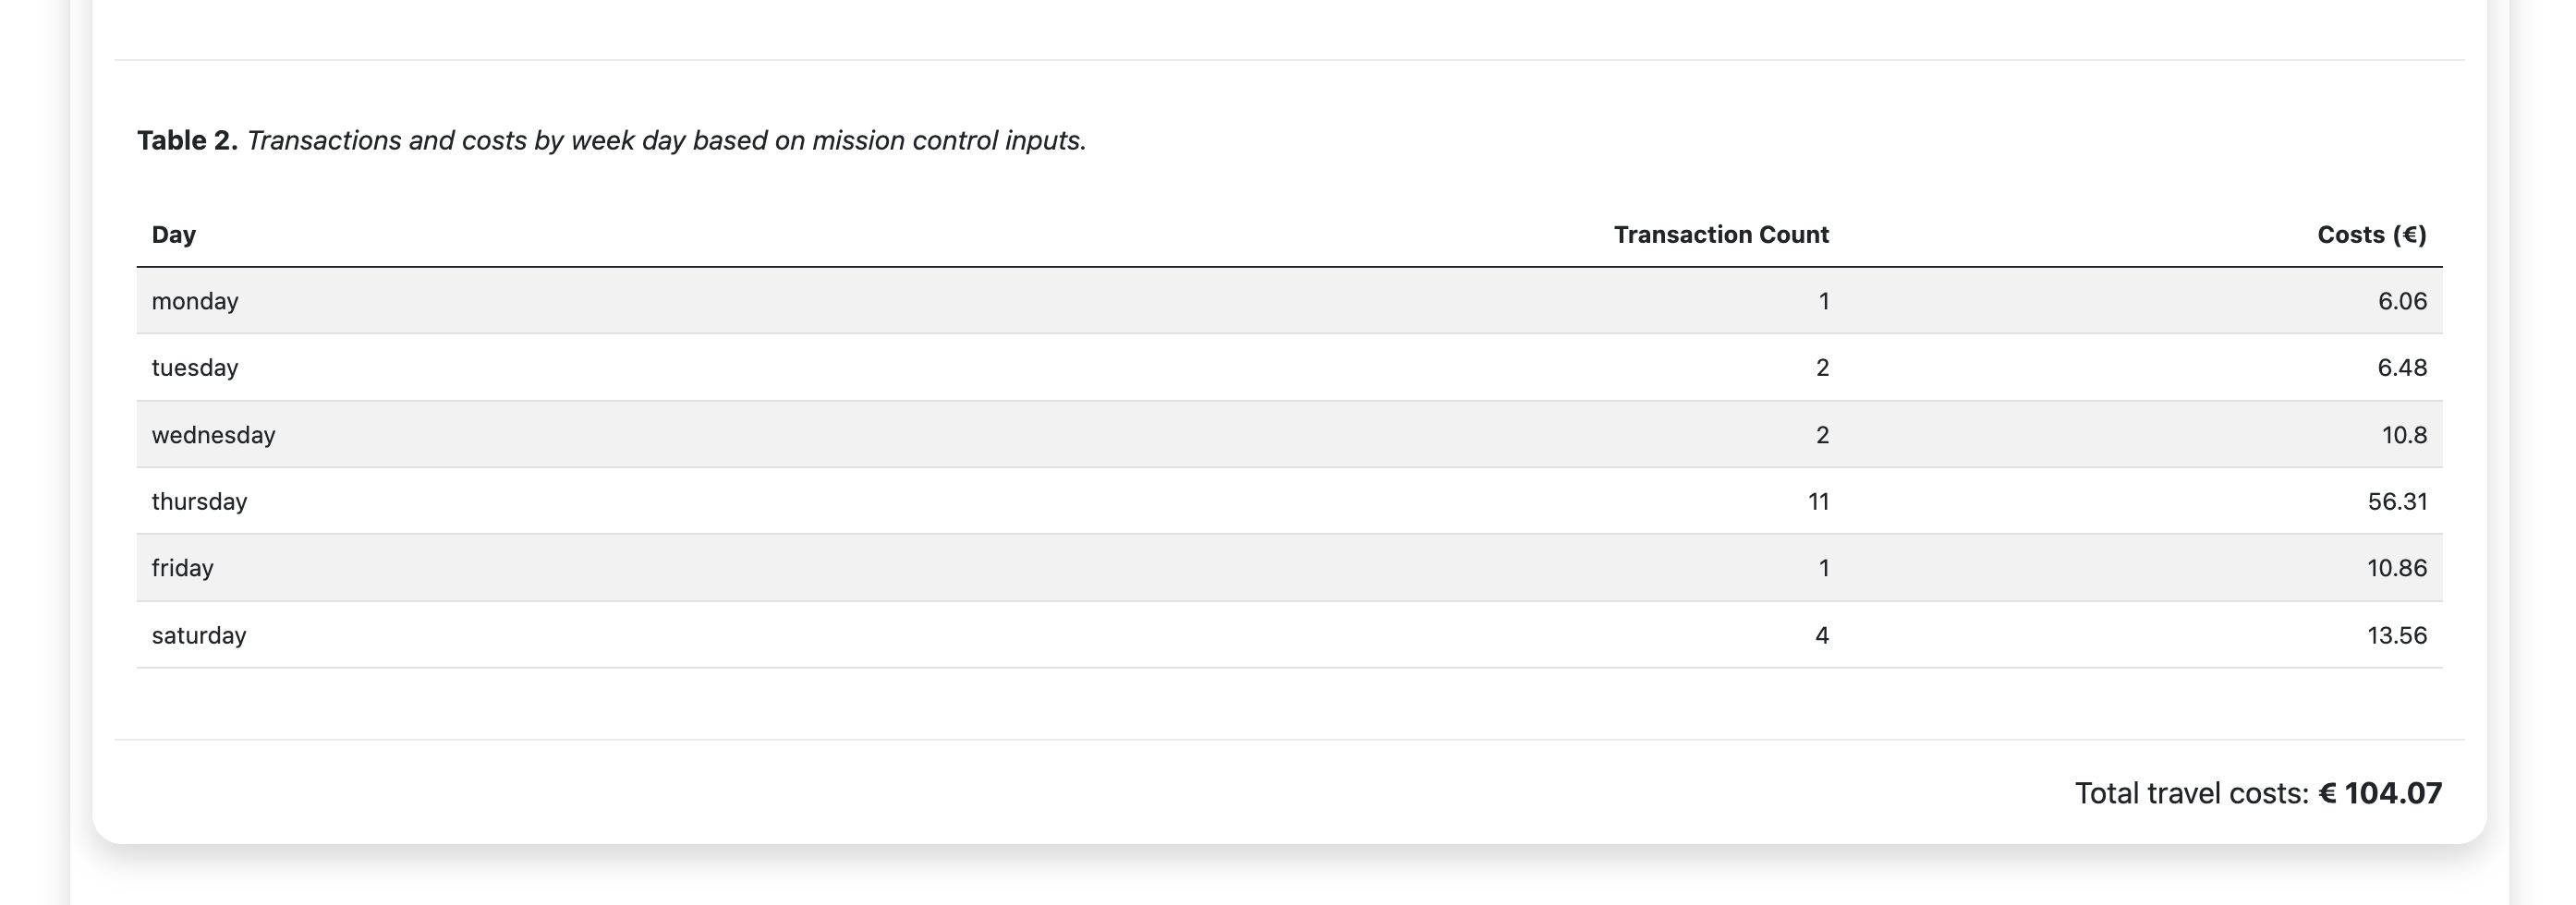
Table 2 (i.e., indicated by number four) displays the number of transactions (e.g., train travels) and travel costs for each day selected in the Mission Control panel.
-
Finally, the section indicated with number five displays the total travel costs based on the current selection of filters.
Commuting Telemetry Panel
The next two images below provide an example of what Table 1 and 2 look like when they are filled with data. Once the data is loaded, a download button is also available on the top-right side of the panel (i.e., indicated by number six in the image below).
Table 1. Processed NS data
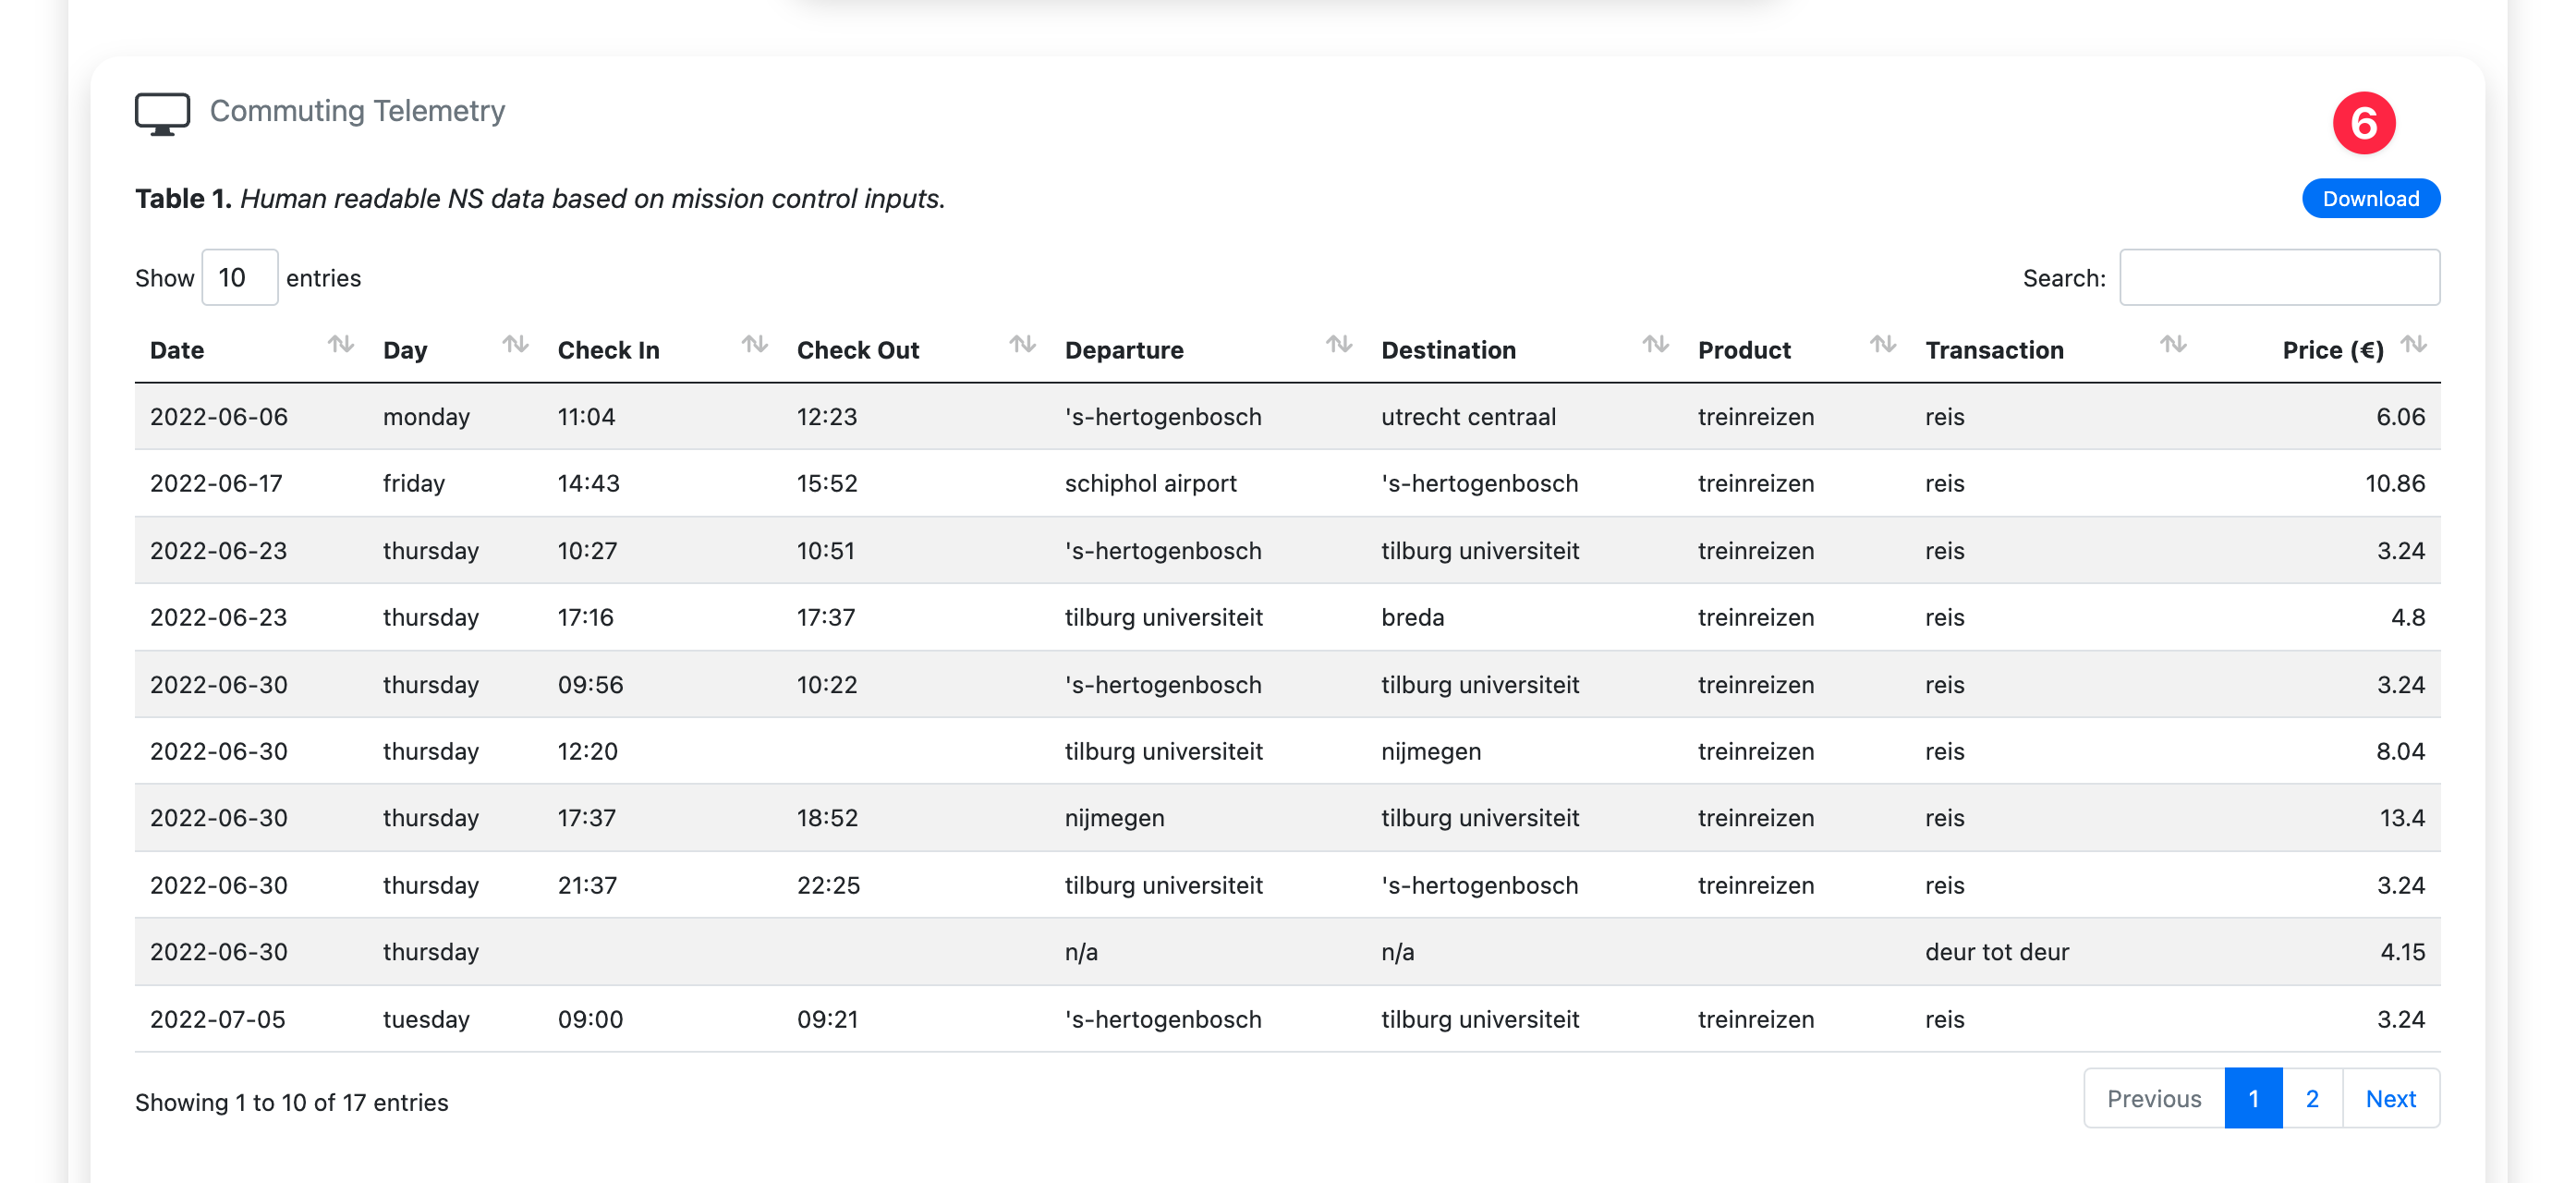
Table 2. Transactions and travels costs by day
Aggregating
The aggregation switch in the Mission Control enables you to aggregate by travel date. When this switch is on, Table 1 will display the aggregated data instead of the complete processed NS one (i.e., see the image below for an example).
Table 1. Aggregated data by date
Aggregating by travel date, and fixing the departure and destination station, can be handy when you want to report your travel history for reimbursing the commute expenses.
Exporting
The download button in the Commuting Telemetry panel allows you to export the
data in Table 1 in .csv format easily. The export considers the
filterers used in the Mission Control panel, including whether the aggregation
switch is on or not.
Installation
Aside from accessing the application at mihaiconstantin.shinyapps.io/trainometer, you can also download and run it locally. To do so, you need to perform a series of steps.
First, download the repository, e.g.:
# Clone the repository.
git clone https://github.com/mihaiconstantin/trainometer.git

# Enter the repository.
cd trainometer
Start an R session, or open the folder in RStudio, then run the following:
# Load shiny.
library(shiny)

# Run app.
runApp(".")
Note that the application also depends on the DT and shinyWidgets packages.
You may also need to install these two packages, e.g.:
install.packages(c("DT", "shinyWidgets"))
Development
Should the NS change the data export format in the future, the data
pre-processing logic is encapsulated in the load_ns_data function, i.e.:
https://github.com/mihaiconstantin/trainometer/blob/58908f5a49bf712b41eafcd9a997e704c62e0210/global.R#L77-L137
Ensuring that load_ns_data returns a data frame that contains the following
columns will keep the application running:
date- The date of the travel.day- The day of the travel.check_in- The check in time.check_out- The check out time.departure- The departure station.destination- The destination station.product- The type of product (e.g., train, bus etc.).transaction- The transaction type (e.g., reis, deur tot deur etc.).price- The costs associated with the product.
Release Notes
See the CHANGELOG file.
Contributing
Any contributions, suggestions, or bug reports are welcome and greatly appreciated.
License
TrainOmeter is licensed
under the MIT license.
Icons and logo
by
twemoji project
licensed under
CC BY 4.0![]()
![]() .
.